A powerful scientific/engineering data visualization and analysis tool. Enhance your scientific and engineering data analysis with Graphis, the ultimate visualization tool. With its powerful features and user-friendly interface, Graphis helps you uncover insights and present your findings with clarity. Take control of your data today and experience the power of Graphis.
Tool for Visualizing and Analyzing Scientific and Engineering Data
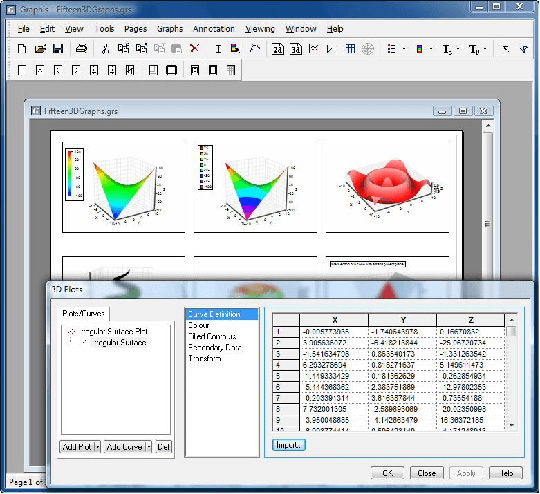
Graphis software was designed to be a powerful scientific/engineering data visualization and analysis tool. At the core of its functionality is the ability to create both tabular and analytical curves. Tabular curves can be used to plot data held in tabular form, while analytical curves can be used to plot mathematical expressions. Graphis has emerged as a powerful scientific engineering data visualization and analysis tool, offering invaluable assistance in understanding complex systems and phenomena. The intricacy and the sheer volume of today's data require sophisticated tools for interpretation, and Graphis fits perfectly into that niche.
Graphis 2D and 3D plotting software can also be driven remotely from another program via COM automation. Controlling Graphis from a programming language provides a wide range of possibilities, from writing code which interactively controls Graphis via your own dialogs, to creating movies utilising any combination of Graphis features you wish. Not only does it handle large datasets with remarkable ease, but it also allows users to visualize this information via interactive graphical representations. These visuals aid in uncovering hidden patterns, trends, and correlations that might otherwise remain unnoticed.
This robust software goes beyond merely presenting data - it opens up avenues for comprehensive analysis too. With Graphis at my disposal, I have been able to delve deeper into my research findings without getting overwhelmed by the complexity of raw data. Its user-friendly interface minimizes the learning curve associated with typical high-powered analytical tools while maintaining a high degree of functionality. Furthermore, by employing algorithms for statistical modeling, machine learning, and other advanced computational methods under its hood, Graphis genuinely empowers scientists and engineers to harness their data's full potential.
How Scientists and Engineers are Leveraging Graphis to Solve Complex Problems
In the ever-evolving fields of science and engineering, data visualization plays a crucial role in understanding complex information. As researchers, engineers, and scientists strive to make sense of vast amounts of data, they require a tool that can transform raw numbers into meaningful insights. That's where Graphis comes in.
Graphis is an advanced graphing software that revolutionizes the way scientific and engineering data is visualized and analyzed. With its powerful features and intuitive interface, it empowers professionals to unlock the true potential of their data.
Whether you are dealing with intricate engineering datasets or conducting scientific experiments, Graphis provides a comprehensive solution for visualizing your findings. Its wide range of graph types, customizable templates, and interactive features allow you to create visually stunning representations of your data with ease.
One of the key advantages of Graphis is its ability to handle large datasets effortlessly. It can handle complex calculations and generate high-quality graphs in real-time, saving valuable time for researchers who need quick access to accurate visualizations.
Furthermore, Graphis offers advanced analytical capabilities that go beyond basic graphing tools. It allows users to perform statistical analysis on their data directly within the software, enabling them to uncover hidden patterns or trends that may have gone unnoticed otherwise.
Whether you are presenting your findings to colleagues or seeking insights for decision-making purposes, Graphis ensures that your message is conveyed effectively through visually compelling graphs. Its user-friendly interface makes it accessible even for those without extensive technical expertise in data visualization.
Graphis stands as a game-changing tool in the realm of scientific and engineering data analysis. With its cutting-edge features and unmatched versatility, it empowers professionals to extract meaningful insights from complex datasets efficiently. Say goodbye to cumbersome spreadsheets and embrace the power of visual storytelling with Graphis - where science meets artistry.
The Power of Advanced Analysis Tools in Graphis: Uncover Hidden Patterns and Insights in Your Data
In today's data-driven world, the ability to uncover hidden patterns and insights in your data is crucial for making informed decisions. That's where advanced analysis tools like Graphis come into play.
Graphis offers a wide range of statistical analysis capabilities that can help you make sense of complex datasets. Whether you're looking to perform regression analysis or apply curve fitting algorithms, Graphis has the tools you need to extract valuable insights from your data.
By harnessing the power of Graphis, you can go beyond basic data visualization and delve deeper into the underlying trends and relationships within your dataset. This level of analysis allows you to make more accurate predictions, identify potential outliers, and ultimately make better-informed decisions for your business.
With its user-friendly interface and robust functionality, Graphis empowers both novice users and experienced analysts alike to leverage the full potential of their data. Whether you're a researcher, a business analyst, or a data scientist, Graphis provides the tools necessary to unlock hidden patterns and gain a deeper understanding of your data.
Don't let valuable insights remain hidden in your data any longer. Embrace the power of advanced analysis tools like Graphis and take your data analysis capabilities to new heights.
Tips and Tricks: Mastering the Art of Data Visualization with Graphis
When it comes to data visualization, mastering the art of presenting information in a visually appealing and easily understandable way is crucial. With the help of Graphis, a powerful data visualization tool, you can take your skills to the next level and create captivating visuals that effectively communicate your message.
One of the key best practices in data visualization is choosing color schemes wisely. Graphis offers a wide range of color palettes and themes that can enhance the clarity and impact of your visualizations. By selecting colors that complement each other and using appropriate contrast, you can ensure that your audience can easily distinguish between different data points.
Another important aspect of effective data visualization is adding labels and annotations for clarity. Graphis provides various options for labeling your charts, graphs, and diagrams. You can add clear titles, axis labels, legends, and callouts to provide context and guide your audience through the information presented.
By utilizing these tips and tricks with Graphis, you can transform complex data into visually engaging representations that are easy to interpret. Whether you are creating reports for business analysis or presenting research findings, mastering the art of data visualization will enable you to convey insights with precision and impact.
Graphis runs on
Windows 9X/ME/2K/XP/2003/Windows 10/11
and is available under the
Time-limited Trial
license
— the installer is 33 MB.
We’ve catalogued it under
AutoCAD Utilities.
Help fellow users decide. Share your experience with Graphis.